
3 Steps to Find Where Your Business Is Losing Up to 40% on Energy Cost — Without Replacing a Single Asset
Most Nigerian business owners and managers already know energy is one of the biggest monthly costs.
But what you probably don’t know is exactly where it’s going.
- You suspect the generator is running when it shouldn’t be — but you can’t prove it.
- Diesel keeps disappearing faster than it should, and you have a quiet suspicion about theft or leakage — but no hard evidence.
- Staff have been told to “reduce consumption” more than once. Nothing changed, because nothing was ever measured.
- You bought a bigger generator instead of fixing the real problem, and the bills still didn’t come down.
- Every month, NEPA and diesel costs land on your desk as one number — with no breakdown of what’s normal, what’s waste, and what’s a spike you should be worried about.
Here’s the uncomfortable truth: you can’t fix what you can’t see.
And right now, your energy spend is a black box.
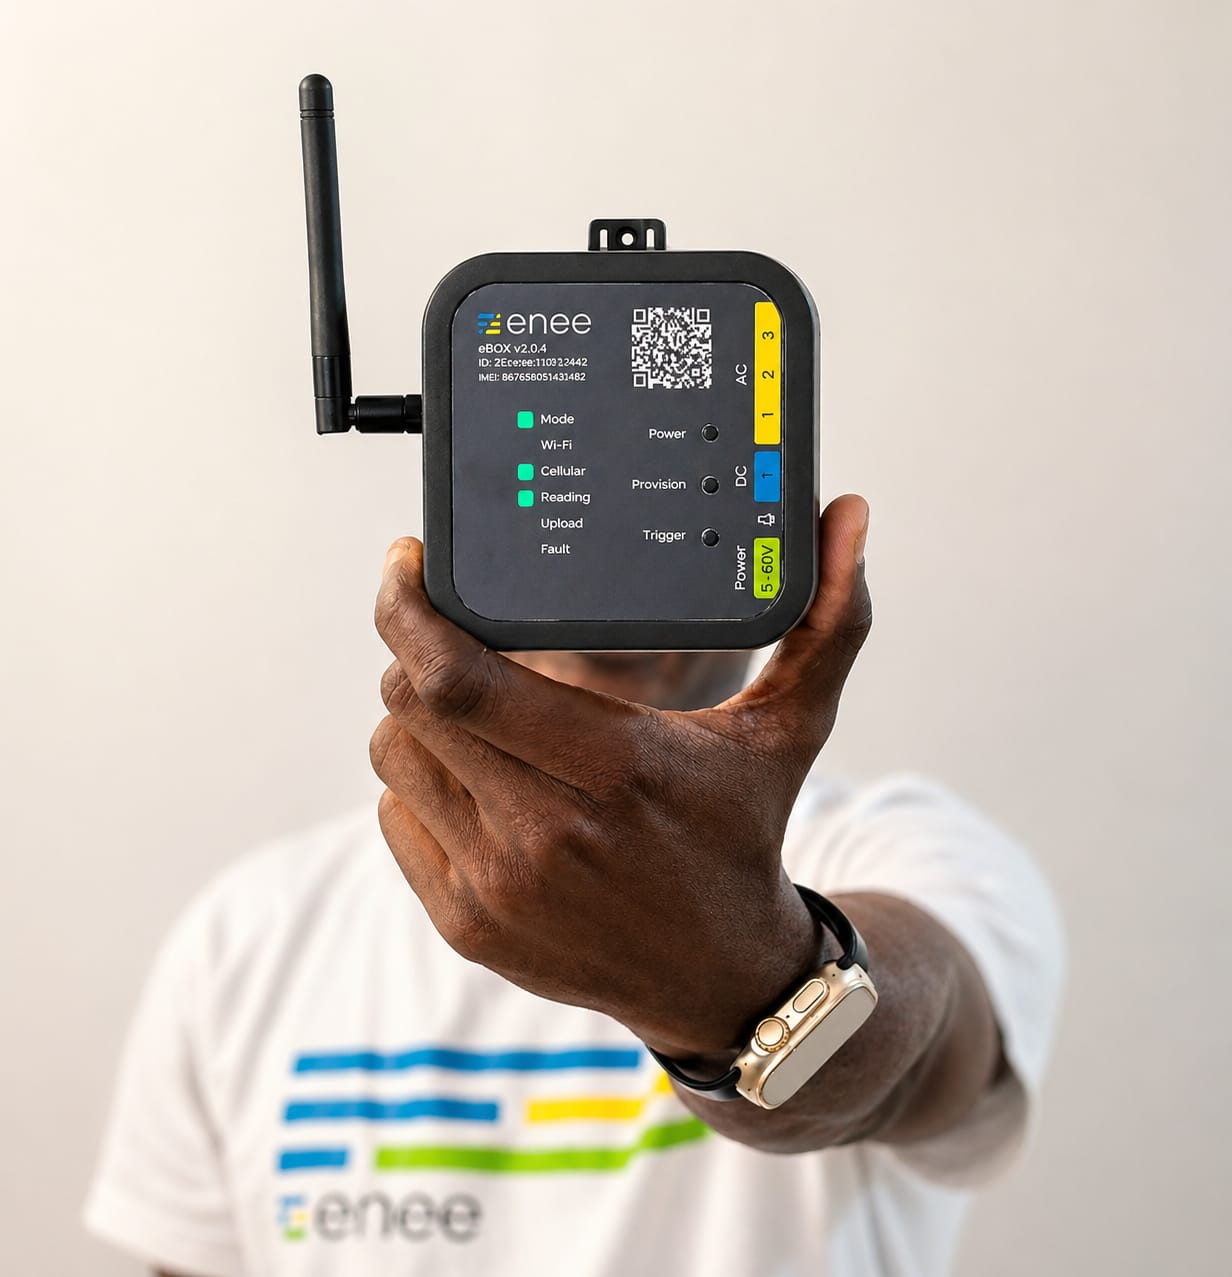
The Hidden Truth About Your Business Energy Cost
Every month you run on guesswork instead of data, that black box keeps costing you.
We pulled this straight from a live monitoring report we ran for a client this year:
A commercial site we monitored found that its generator supplied just 33.9% of total energy for the month — but carried 55.3% of the total energy cost. Diesel power was costing roughly 2.4x more per unit than grid power, and nobody had the data to see it until we measured it.
That’s not a one-off.
It’s the pattern we see everywhere we install monitoring: the most expensive power source is almost always running more than it needs to, and almost nobody has the numbers to prove it — until they do.
Meanwhile:
- “Staff warnings” don’t work without measurement, because there’s no accountability without a number attached to the waste.
- Manual diesel logs can’t catch patterns or theft with any confidence — people already know what a paper log can and can’t see.
- Buying more generator capacity treats the symptom, not the leak.
- Random technician call-outs fix what’s visible, not what’s actually draining your account every month.
The longer the leak stays invisible, the more it costs you — quietly, every single month.
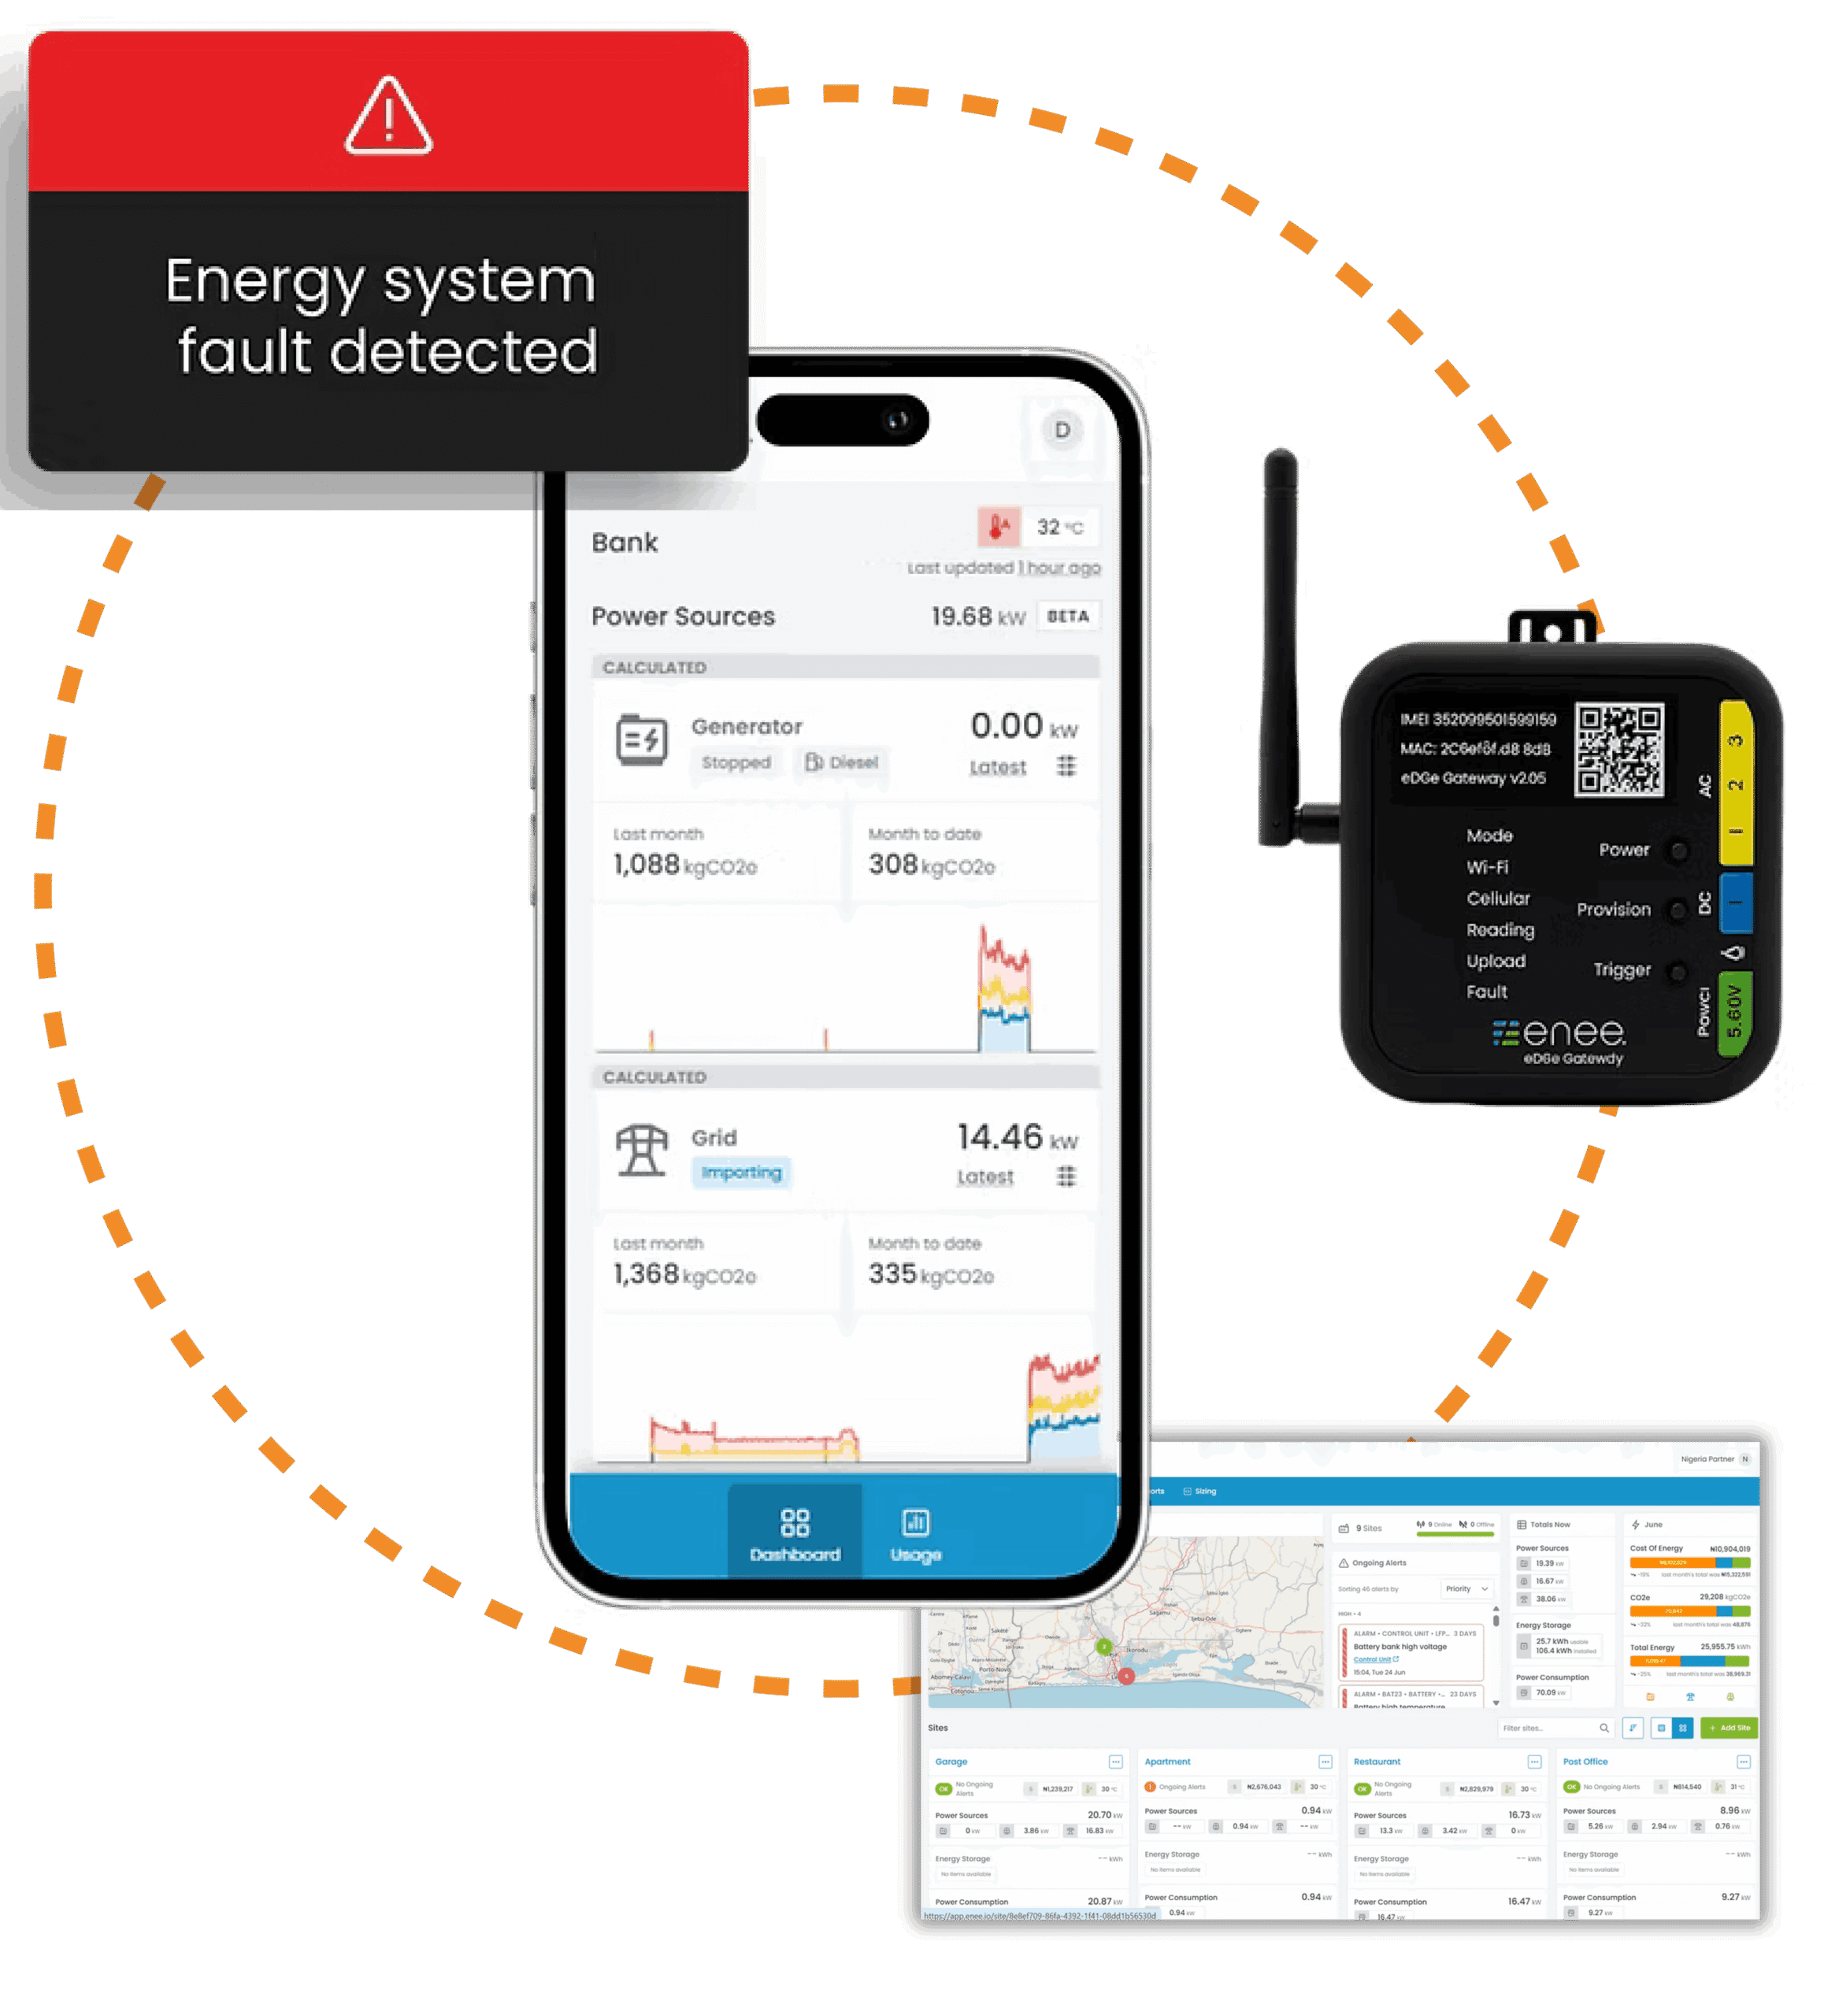
Introducing the No. 1 Energy Fitness Tracker
Think of it as a fitness tracker for your power system.
A fitness tracker doesn’t guess how many steps you took, how well you slept, or how hard your heart worked — it measures it, in real time, and shows you the pattern over days and weeks.
BOYLS does the same thing for your energy system.
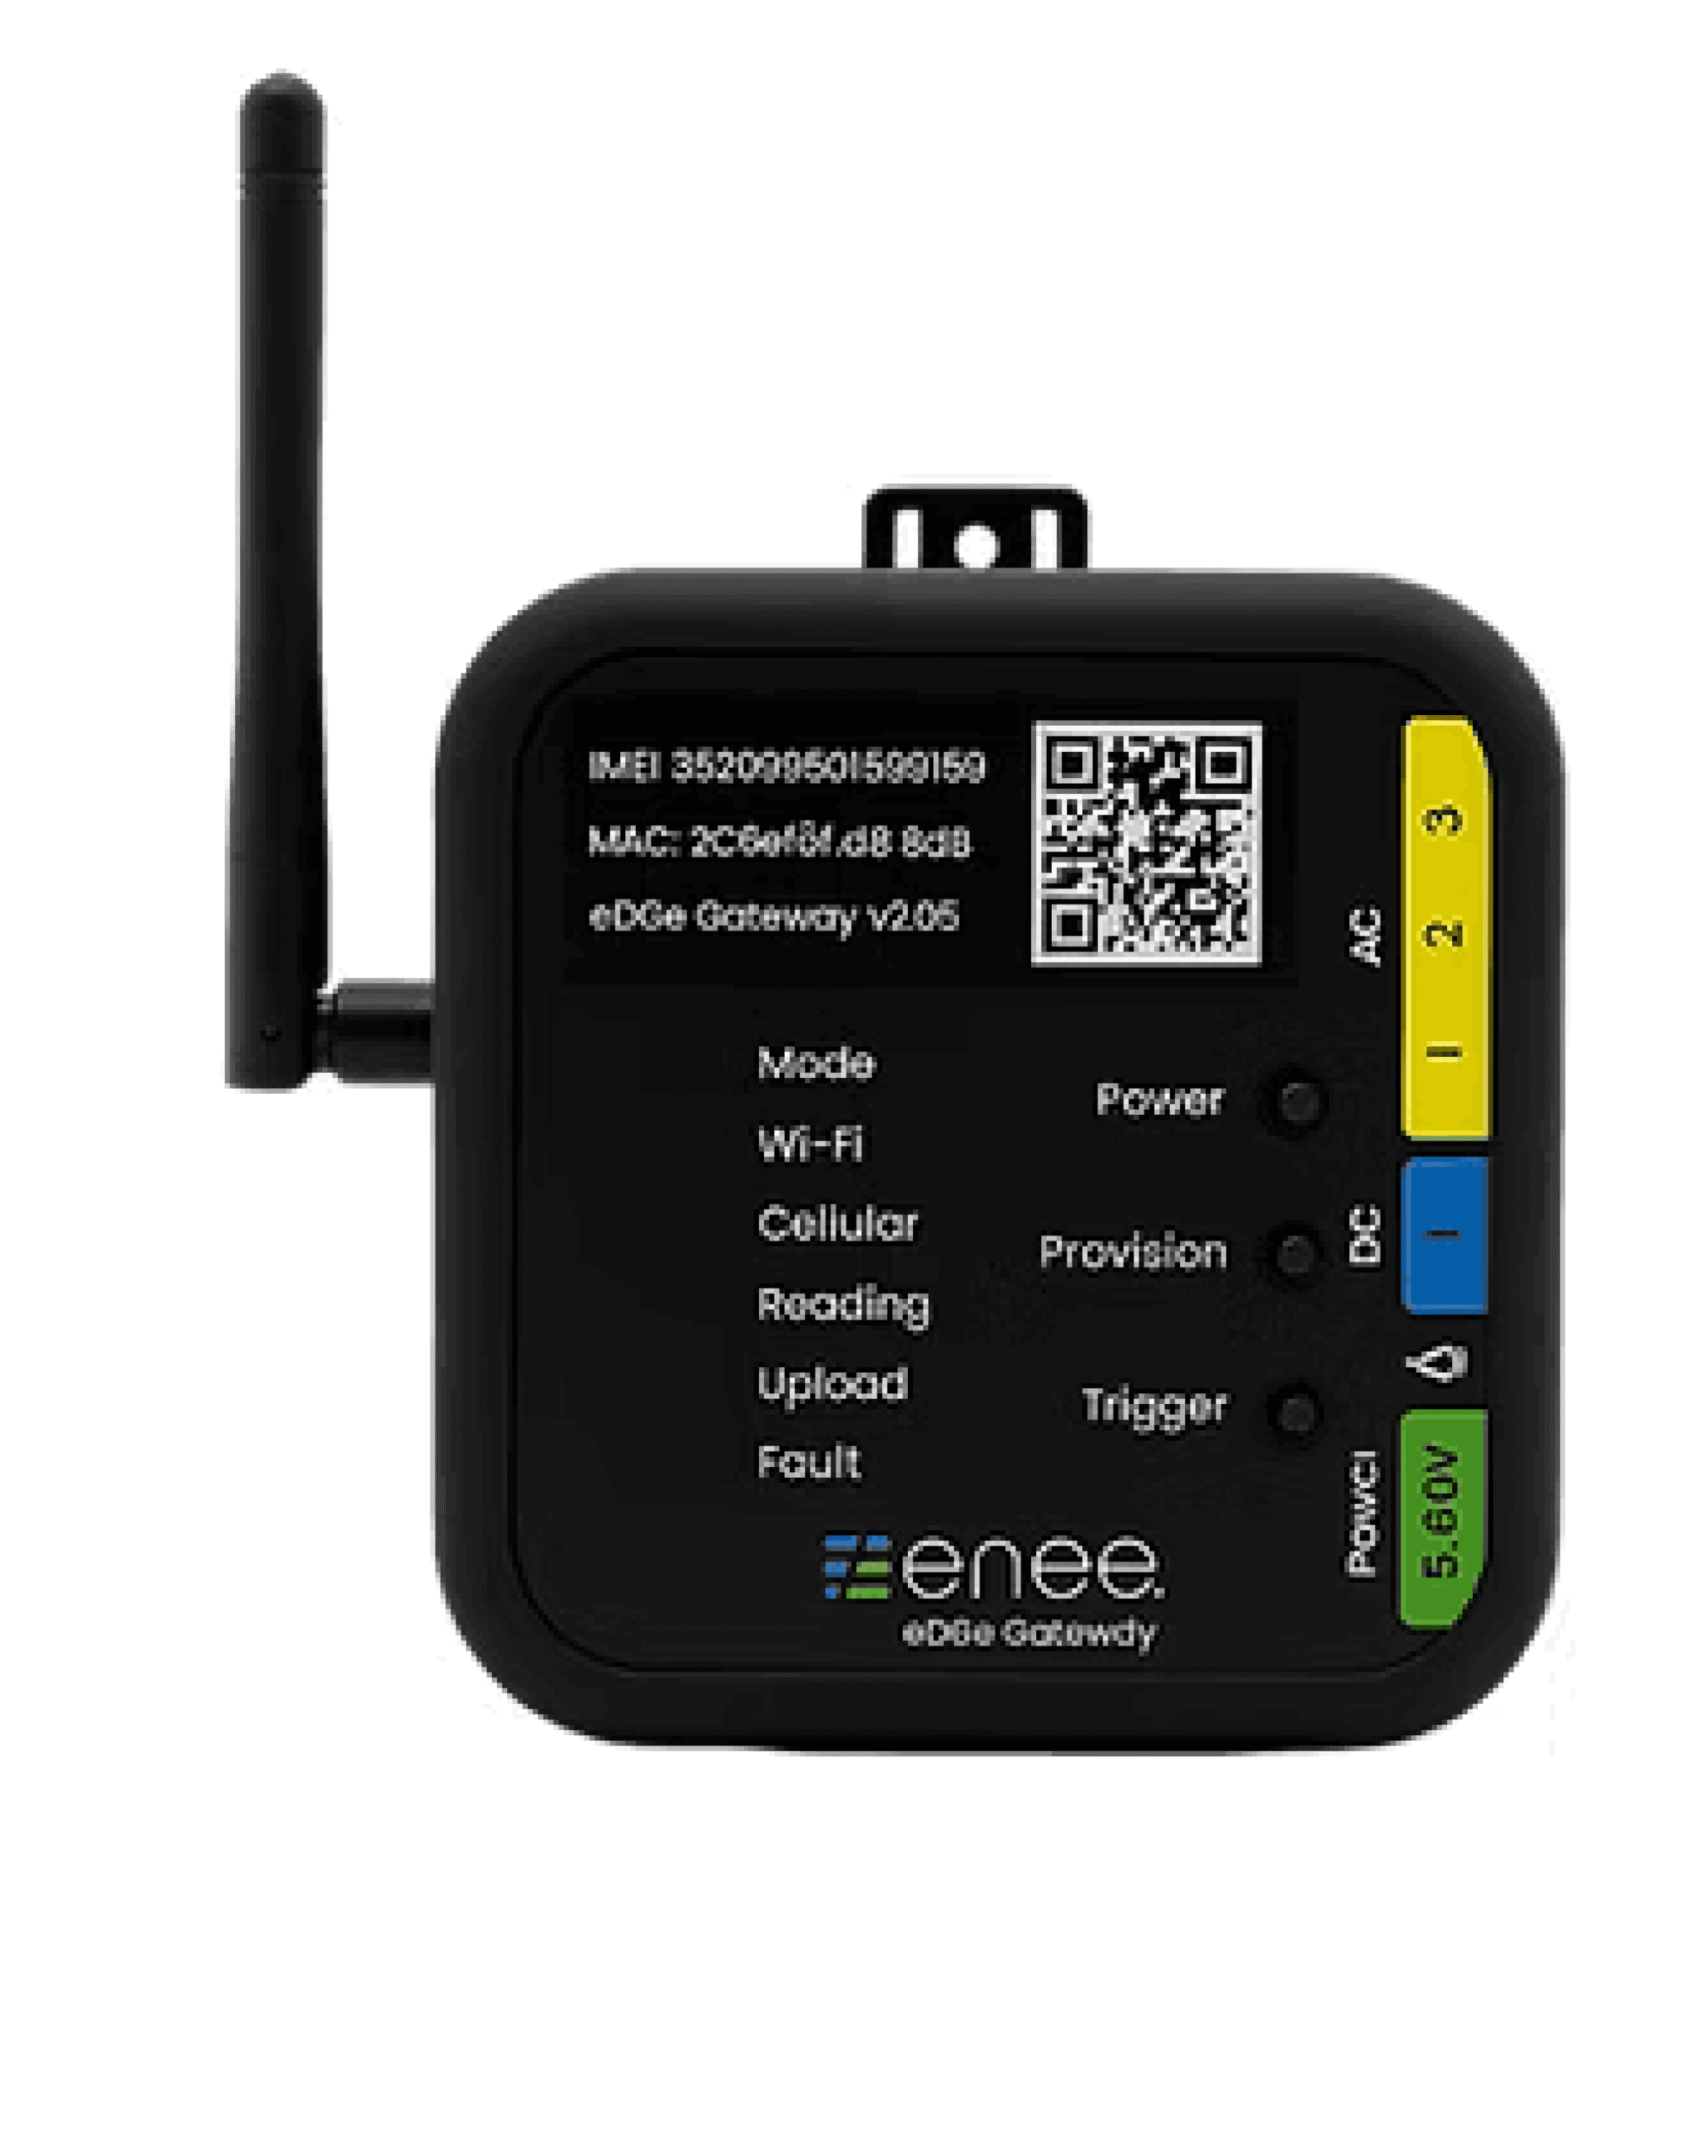
We install monitoring sensors across every power source on your site — grid, generator(s), solar, and major loads — and give you a live, plain-language picture of:
- Where your energy is coming from (grid vs. generator vs. solar) and what each source is really costing you per unit
- When and where waste is happening — by zone, by equipment, by hour of the day
- How your generator is actually performing — right-sizing, load matching, fuel efficiency, and runtime you didn’t know was happening
- Whether diesel is disappearing where it shouldn’t — with real data behind the suspicion, not just a feeling
- Load imbalance and electrical health issues that are stressing your equipment and shortening its life
Once you can see it, you can fix it.
And once it’s fixed, ongoing monitoring keeps it fixed — with alerts the moment something drifts back toward waste.
This is how It Works (Simple & Proven)
This is the same structured audit process we use for commercial facilities, such as malls, schools, banks, supermarkets, and hospitals.
Phase 1 — Energy Audit:
We install temporary monitoring across your grid, generator(s), and major loads for a defined period (typically 2–4 weeks).
No disruption to your operations. At the end, you get a full report: your true energy baseline, where the waste is, and a prioritized action plan — in plain language, not jargon.
Phase 2 — Ongoing Monitoring Subscription:
Once the leak points are known, we keep the sensors in place.
You get a live dashboard, monthly optimization reports, and real-time alerts — so waste that creeps back in gets caught immediately, not three months and one bad bill later.
Optional: if the audit reveals a case for solar, battery, or equipment upgrades, we can design and install that too — but the core service is audit + monitoring, not a sales pitch for hardware you don’t need yet.:
Kikspro Meats & Farmers Market — cold-chain / refrigeration. Lagos Nigeria
Diesel supplied only 16% of this site’s energy — but was eating 40–50% of the monthly bill. Once we mapped the waste (generator mis-sizing, slow grid switch-back, cold-room inefficiency), the identified savings opportunity came to ₦750,000–₦1,300,000 a month, with a realistic path to cutting total energy cost by over 40%.
Bature Brewery — food & beverage/hospitality. Lagos Nigeria
Monitoring showed the generator supplied 33.9% of energy but carried 55.3% of total cost — generator power was running at roughly 2.4x the price of grid power. We also found material overnight base-load waste: cutting just 5kW of unnecessary night load was projected to save ≈₦478,000/month on its own.
Who is This For?
This is built for Nigerian business owners spending ₦500,000 or more per month on grid power and diesel combined — and who are done guessing.
Best fit:
- Hotels & hospitality
- Manufacturing & food processing
- Hospitals & clinics
- Schools
- Supermarkets & cold-chain / farmers markets
- Large estates & estate management
If that’s you, and energy has quietly become a cost you can’t fully explain — this is exactly the problem we solve.
Top Questions Answered
From savings to setup, here’s what most customers ask before making the switch
Will this actually save us money, or just give us more reports?
The audit’s job is to find and prioritize the specific waste points on your site — not hand you a generic PDF. Every recommendation comes with an estimated ₦ impact, the same way you saw in the case studies above.
Will installation disrupt our operations?
Sensors are plug-and-play and installed without shutting down your power sources or interrupting daily operations.
Who actually interprets the data and tells us what to do?
We do. You’re not left staring at a dashboard — you get a written report and a walkthrough of what it means and what to prioritize first.
How fast will we see results?
The audit typically runs 2–4 weeks. Many of the fixes we identify (generator dispatch, switching discipline, load scheduling) can start paying back within the first month of implementation.
What if the audit uncovers mismanagement, waste, or theft internally?
That’s exactly what it’s designed to surface — carefully and factually, with data, not accusation. Most owners tell us this is the single most valuable (and previously invisible) part of the report.